 Address of the President
 175th Anniversary of Russian Railways
 Analysis
 Save Key Indicators to XLS
 Transport Development Strategy
 Investment Activity
 Download Chapter Financial and Economic Performance
 Rating
 Loan Portfolio
 Management System
 Governing Structure Of JSC Russian Railways
 Personnel management
 Housing policy
Service functions
-
Download center
-
Add to My Report
-
My Report (0)
-
Print this Page
-
Download in PDF
-
Share
-
Feedback
-
Interactive analysis
-
Browsing history
-
Offline version
-
Company in soc.networks
-
Compared to 2011
-
Popular pages
-
Company on the map
-
Compact view
| Enter e-mail recipient * | Your e-mail * | Comment : | |
| * required fields | |||
Loading
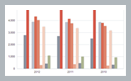
Major trends
- Exports via Russian ports are traditionally a main contributor to an increase in loading
- The main growth drivers are construction cargo, coal, oil and oil products
- The pre-crisis level of coke, cake and container freight loading was exceeded
- A slower growth rate of loading in late 2012 is evidence of a declining trend in demand for industrial products
- JSC "RZD"’s increase in loading was largely due to low-income freight
The daily average loading indicator increased 2.2% versus 2011 (+2.4% in absolute terms) and 14.8% versus 2009. However, it is still below the pre-crisis level (the difference between 2007 is 5.6%) and approximately matches the level of 2005.
Increase in loading and freight turnover is mainly accounted for by exports via Russian ports.
The main growth drivers among commodity groups are construction cargo (+14.4%), coal (+3.9%), oil and oil products (+3.3%). Against a generally positive background, loading volumes of timber cargo (−10.8%), non-ferrous ore and sulfur raw materials (−6.4% in both cases) and fertilizers (−3,1%) declined significantly.
The trend in transportation decline was manifested to its full extent in December 2012: loading volume amounted to 95.6 mln tons or −3.8% versus December 2011. Negative trends were seen for the first time since late 2009; they reflect a decline in demand for industrial products in the economy.