 Address of the President
 175th Anniversary of Russian Railways
 Analysis
 Save Key Indicators to XLS
 Transport Development Strategy
 Investment Activity
 Download Chapter Financial and Economic Performance
 Rating
 Loan Portfolio
 Management System
 Governing Structure Of JSC Russian Railways
 Personnel management
 Housing policy
Service functions
-
Download center
-
Add to My Report
-
My Report (0)
-
Print this Page
-
Download in PDF
-
Share
-
Feedback
-
Interactive analysis
-
Browsing history
-
Offline version
-
Company in soc.networks
-
Compared to 2011
-
Popular pages
-
Company on the map
-
Compact view
| Enter e-mail recipient * | Your e-mail * | Comment : | |
| * required fields | |||
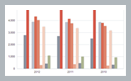
Current Assets
Dynamics of current assets, RUR bln.
| 31.12.2011 | 31.12.2012 | +/− versus 31.12.2011 | % versus 31.12.2011 | |
|---|---|---|---|---|
| Inventory | 76.5 | 77.1 | 0.6 | 0.8 |
| VAT for assets acquired | 6.5 | 8.1 | 1.6 | 24.6 |
| Receivables | 86.0 | 81.4 | −4.6 | −5.3 |
| Financial investments (excluding cash equivalents) | 6.4 | 5.0 | −1.4 | −21.9 |
| Cash and cash equivalents | 180.8 | 113.5 | −67.3 | −37.2 |
| Other current assets | 14.2 | 14.0 | −0.2 | −1.4 |
| Total | 370.4 | 299.1 | −71.3 | −19.3 |
Short-term liabilities
Dynamics of short-term liabilities, RUR bln.
| 31.12.2011 | 31.12.2012 | +/− versus 31.12.2011 | % versus 31.12.2011 | |
|---|---|---|---|---|
| Borrowed funds | 120.7 | 60.2 | −60.5 | −50.1 |
| Payables | 299.4 | 312.3 | 12.9 | 4.3 |
| Deferred revenue | 6.1 | 7.1 | 1 | 16.4 |
| Estimated liabilities | 29.0 | 38.6 | 9.6 | 33.1 |
| Other short-term liabilities | 2.0 | 3.0 | 1 | 50 |
| Total | 457.2 | 421.2 | −36 | −7.9 |
| Total (excluding borrowings) | 336.5 | 361 | 24.5 | 7.3 |
JSC “RZD” manages its current capital according to the following positions:
- payment discipline (timeliness of payments);
- optimization of solvency ratios of the RZD Group;
- management of reserves;
- management of inventories.
Sufficiency of current capital leads to cost minimizing, improving financial results, and company sustainability.
Accordingly, the company uses an aggressive model of current capital management characterized by separation of investment assets financed at the expense of current capital.
At year-end 2012, the company’s WCR (working capital requirement) was RUR (—180.5) bln. The net cash flow from changes in working capital was RUR +1.2 bln. The following factors had an adverse effect:
- growth of receivables of SPCs and creation of bad debt provision for a total amount of RUR 14.8 bln.;
- debt as a result of assignment of rights and obligations under a lease agreement in the amount of RUR 7.3 bln.;
- other (growth of debt for advances issued, reduction of taxes and duties payable).
However, the impact of the above factors was compensated by the growth of payables to suppliers for RUR 25 bln., increase in the amount of estimated liabilities for RUR 9.7 bln.
Analysis of individual items of assets and liabilities is given below.
Due to the current capital management the company could ensure availability of current assets in 2012, which resulted in cost minimizing, improving financial performance, timely fulfilling obligations to contractors, and avoid disruptions in production and sale of products, excessive diversion of current assets to inventory.
Inventory management
At year-end, the company’s inventories amounted to RUR 77.1 bln. with an increase against the beginning of the year by RUR 0.6 bln., including:
Changes in inventories, RUR bln.
| 31.12.2011 | 31.12.2012 | +/− versus 31.12.2011 | % versus 31.12.2011 | |
|---|---|---|---|---|
| Total inventories, including: | 76.5 | 77.1 | 0.6 | 0.8 |
| raw materials and other similar inventories | 74.7 | 75.9 | 1.2 | 1.6 |
| expenses for work in progress | 1.2 | 0.7 | −0.5 | −41.7 |
| finished goods and goods for resale | 0.3 | 0.2 | −0.1 | −33.3 |
| goods shipped | — | — | — | — |
| deferred expenses | 0.3 | 0.3 | — | — |
| other inventories and expenses | — | — | — | — |
Due to the significant upgrading of rolling stock held by the company with the removal of life-expired fleets and posting used spare parts, the growth of inventories was observed in the locomotive, car and business facilities.
Dynamics of changes in emergency stock, seasonal track structure material stock and reused material stock, RUR bln.
| Inventory | 31.12.2011 | 31.12.2012 | %% 31.12.2012 versus 31.12.2011 |
|---|---|---|---|
| emergency stock | 1.9 | 2.7 | 142% |
| seasonal track structure material stock | 1.8 | 14.5 | 806% |
| reused material stock (used track structure material stock and inventory rails) | 7.4 | 8.4 | 114% |
Changes in the availability of inventories for production, days of use
| 31.12.2011 | 31.12.2012 | %% 31.12.2012 versus 31.12.2011 | |
|---|---|---|---|
| Availability of inventories for production, days of use (total) | 53 | 47 | 89% |
| including: | |||
| materials | 59 | 52 | 88% |
| fuel | 34 | 29 | 85% |
Measures aimed at the reduction of the inventory turnover period:
- sale of reused materials not required for the production and economic activities;
- additional sale of scrap metal;
- redistribution of non-core inventories;
- allocation of funds to purchase materials and equipment with account of inventories from own production, reuse of materials and their distribution among subsidiaries, available inventories;
- development and updating technical documentation in order to shorten technological processes, reduce production costs and therefore decrease the number of inventories.
Other current assets
Other current assets as of 31.12.2011 amounted to RUR 14.0 bln. with a decrease against the beginning of year by RUR 0.2 bln. (or by 1%).
Breakdown of other current assets, RUR bln.
| 31.12.2011 | 31.12.2012 | +/− versus 31.12.2011 | |
|---|---|---|---|
| property by the right of operational management | 0.3 | 0.3 | 0.0 |
| Value added tax for advances received | 8.9 | 8.6 | −0.3 |
| shortages and losses from impairment of assets | 0.6 | 0.5 | −0.1 |
| accrued but not due revenue | 4.5 | 4.4 | −0.1 |
| immovable property transferred to buyers before recognition of revenue from sale | — | 0.2 | 0.2 |
| Total | 14.2 | 14.0 | −0.2 |
Deferred revenue increased by RUR 1 bln. against the beginning of the year. The balance as of 31.12.2012 is RUR 7.1 bln.
Dynamics of deferred revenue, RUR bln.
| 31.12.2011 | 31.12.2012 | +/− versus 31.12.2011 | |
|---|---|---|---|
| Total | 6.1 | 7.1 | 1 |
At the end of the reporting period estimated liabilities were RUR 39 bln., including:
Dynamics of short-term liabilities, RUR bln.
| 31.12.2011 | 31.12.2012 | +/− versus 31.12.2011 | % versus 31.12.2011 | |
|---|---|---|---|---|
| Bonuses and leave allowances, including: | 19.7 | 24.4 | 4.7 | +23.8 |
| Other payments to employees | 3.6 | 5.6 | 2 | +51.4 |
| Legal proceedings: | 2.2 | 5.3 | 3.1 | +140.9 |
| Bank guarantees | 3.4 | 3.3 | −0.1 | −2.9 |
| Total | 29.0 | 38.6 | 9.6 | +33.1 |
Other short-term liabilities
Other short-term liabilities as of 31.12.2011 amounted to RUR 3.0 bln. with a decrease against the beginning of year by RUR 1.0 bln. (or by 50%).
Breakdown of other current assets, RUR bln.
| 31.12.2011 | 31.12.2012 | +/− versus 31.12.2011 | |
|---|---|---|---|
| Value added tax for advances paid | 2.0 | 3.0 | 1.0 |
| Total | 2.0 | 3.0 | 1.0 |
Accounts receivable and payable management
Receivables as of 31.12.2012, RUR bln.
| 2011 | 2012 | +/− 2012 vs 2011 | % 2012 vs 2011 | |
|---|---|---|---|---|
| Total buyers and customers (sales receivables), including: | 19.0 | 12.8 | −6.2 | −33% |
| for transportation | 3.1 | 2.5 | −0.6 | −19% |
| other yers and customers | 15.9 | 10.3 | −5.6 | −35% |
| Advances paid | 24.2 | 32.1 | +7.9 | +33% |
| including capital investments | 13.8 | 22.4 | +8.6 | +62% |
| Social insurance and social security | 0.6 | 0.5 | −0.1 | −17% |
| Taxes and levies | 5.3 | 6.6 | +1.3 | +25% |
| Wage settlements and other settlements with persons accountable | 0.3 | 0.2 | −0.1 | −33% |
| Other debtors | 36.5 | 29.2 | −7.3 | −20% |
| Total | 86.0 | 81.4 | −4.6 | −5% |
| Sales receivable turnover period, days | 4.7 | 3.0 | −36% |
As a result of the work performed, the average length of turnover (turnover period) of receivables for sales (transportation and other) was 3 days (-2 days against 2011).
At year-end of 2012, receivables of JSC “RZD” amounted to RUR 81.4 bln. with a decrease against the beginning of the year by RUR 4.6 bln. (or 5%). The greatest decrease is associated with receivables from buyers and customers, other than transportation, (-35%), other debtors (-20%). At the same time the growth of receivables for advances paid (including under long-term projects) was 33%, for taxes and levies — 255.
Receivables from buyers and customers (other than transportation) decreased against the beginning of the year by RUR 5.6 bln. (-35%) and amounted to RUR 10.3 bln., including for sale of inventories and other assets — by RUR 5.6%, for lease — by RUR 0.3 bln., for social services — by RUR 0.2 bln. Receivables from subsidiaries and affiliates was RUR 4.1 bln. (40% of the total receivables from buyers and customers), including debts of:
- suburban passenger companies — RUR 2.4 bln. (lease of multiple units (MU)),
- FPC — RUR 1.5 bln. (lease of traction rolling stock (TRS)),
- car repair companies (VRK-1, VRK-2, VRK-3) — RUR 0.2 bln.,
- JSC “TD RZD” — RUR 0.5 bln,
- TransTeleCom — RUR 0.2 bln. (lease of the Single Network Digital Communication Network).
As of 31.12.2012, the balance sheet of JSC “RZD” shows receivables (including the bad debt reserve) from suburban passenger companies (including the Federal Railway Transport Agency (FRTA)) in the amount of RUR 36.6 bln. (+ RUR 13.1 bln. against the beginning of the year).
Changes in receivables by suburban passenger companies for 2012 (including receivables in reserve), RUR bln.
| Item | for 2012 |
|---|---|
| Balance at the beginning of the period, including receivables in reserve | 23.5 |
| including receivables in reserve | 22.8 |
| Loss of unprofitable SPCs | 6.3 |
| Increase in the debt of federal and regional authorities to SPCs | 0.0 |
| Difference between revenues from infrastructure services and subsidies received | 7,0 |
| Other factors of changes in receivables from SPCs | −0.2 |
| Balance at the end of the period, including receivables in reserve | 36.6 |
| including receivables in reserve | 36.1 |
Of these, the reserve for bad debts of SPCs (including the FRTA) includes RUR 36.1 bln.
The growth of the bad debt reserve is associated, first of all, with a failure of suburban passenger companies (SPCs) to pay for infrastructure services and lease of rolling stock with a crew (relating to other activities) due to their unprofitability. The reason for the increase in the debt of suburban passenger companies is the constituents’ failure to fulfil their obligations to compensate shortfalls in income of SPCs due to the state regulation of tariffs (for more details see Section “Suburban Passenger Traffic”), which at year-end of 2012 amounted to RUR 6.3 bln.
Moreover, it should be noted that in 2012 JSC “RZD” effectively collaborated with relevant ministries and state authorities in order to adopt the Rules for Subsidizing JSC “RZD” from the Federal Budget to compensate revenue losses resulted from the state regulation of tariffs for public railway infrastructure services provided for suburban passenger traffic and receive a subsidy in the amount of RUR 25 bln., preventing the growth of receivables from SPCs in this amount. Nevertheless, the subsidy received did not cover the difference between the basic and exceptional tariff in full, which resulted in receivables from the FRTA in the amount of RUR 7.0 bln.
Thus, as of 31.12.2012, the total receivables from the FRTA to JSC “RZD” for the period of
However, the financial result from the changes in receivables in the reserve was RUR —14.5 bln. The breakdown of the bad debt reserve is given in the table below.
Bad debt reserve as of 31.12.2012, RUR bln.
| Item | |
|---|---|
| Total reserve | 74.3 |
| including SPCs | 36.1 |
| Ministry of Health and Social Development | 10.9 |
| Libya project | 24.6 |
| other (housing and public utilities, etc.) | 2.7 |
The financial result from changes in bad debt reserves amounted to 1.1% of income of JSC “RZD” for 2012 (the international practice shows companies’ reserving up to 1.5% of their revenues).
Receivables for advances paid increased by RUR 7.9 bln. (or +33%) against the beginning of the year and made up RUR 32.1 bln.
Tax liabilities amounted to RUR 6.5 bln., with an increase of RUR 1.2 bln. (or +23%) against the beginning of the year, including VAT of RUR 6.1 bln. (it will be reclaimed in 1Q 2013).
Other receivables amounted to RUR 29.2 bln.
Payables of JSC “RZD”, RUR bln.
| 31.12.2011 | As of 31.12.2012 | including overdue | +/− 31.12.2012 vs. 31.12.2011 |
% 31.12.2012 vs. 31.12.2011 |
|
|---|---|---|---|---|---|
| Payables to suppliers and contractors | 152.5 | 177.5 | 0.4 | +25.0 | +16% |
| investment activities | 84.0 | 100.2 | — | +16.2 | +19% |
| operating activities | 68.5 | 77.3 | — | −8.8 | +13% |
| Wage settlements and other settlements with persons accountable | 13.9 | 15.1 | 0.0 | +1.2 | +9% |
| Debts related to social insurance and social security | 6.2 | 7.3 | 0.0 | +1.2 | +18% |
| Debts related to taxes and levies | 25.5 | 12.6 | 0.0 | −12.9 | −51% |
| Advances received from other transactions | 17.9 | 18.6 | 0.0 | +0.7 | +4% |
| Advance payment for transportation | 70.6 | 70.5 | 0.0 | −0.1 | — |
| Outstanding distribution to shareholders | 0 | 0 | 0.0 | 0 | — |
| Other payables | 12.8 | 14.1 | 0.1 | +1.3 | +10% |
| Total | 299.4 | 315.7 | 0.5 | +16.4 | +5% |
| Total payables, excluding advances received | 210.9 | 226.7 | 0.5 | +15.8 | +7% |
| 2011 | In 2012 | +/− vs 2011,% | |||
| Turnover period, days | 34.4 | 38.1 | +11% | ||
| operating activities | 29.1 | 32.3 | +11% | ||
| investment activities | 41.5 | 45.3 | +9% |
Payables increased by RUR 16.4 bln. (or 5%) against the beginning of the year.
Payables to suppliers and contractors increased by RUR 25.0 bln. (or 16%), other payables — by RUR 1.3 bln. (or 10%), debts related to taxes and levies decreased by RUR 12.9 bln. (or 51%).
The increase of payables to suppliers and contractors to RUR 177.5 bln. is caused by the growth of debts relating to investment activities of JSC “RZD” by RUR 16.2 bln. (or 19%).
At year-end 2012, the turnover period of payables to suppliers and contractors was 38,1 days for the company in general, with increase by 3,7 days against the same period of the previous year. The increase in the turnover period of payables to suppliers and contractors in the reporting period was mainly caused by the turnover period of debts related to investment activities associated with fluctuations in work volumes and guarantee withholdings.
As of 31.12.2011, the payables to suppliers and contractors relating to investment activities was RUR 100.2 bln., including: payables that arose in December 2012 in the amount of RUR 71.4 bln.
- payables that arose in December 2012 in the amount of RUR 71.4 bln.
- guarantee withholdings in the amount of RUR 25.4 bln.
As of the end of the reporting year, advances received (other than transportation) amounted to RUR 18.6 bln. (RUR 0.74 bln. or 4% against the beginning of the year), including those received for construction of a railway line (Libya) — RUR 13.6 bln.
Advances received from transportation remained at the level of 2011 and amounted to RUR 70.5 bln.
Tax liabilities decreased by RUR 12.9 bln., or 51%, against the beginning of the year and made up RUR 12.6 bln.
Other payables as of 31.12.2011 amounted to RUR 14.1 bln. with a decrease by RUR 1.3 bln. (or by 10%) against the beginning of year.
Due to the current capital management the company could ensure availability of current assets in 2012, which resulted in cost minimizing, improving financial performance, timely fulfilling obligations to contractors, and avoid disruptions in production and sale of products, excessive diversion of current assets to inventory.