 Address of the President
 175th Anniversary of Russian Railways
 Analysis
 Save Key Indicators to XLS
 Transport Development Strategy
 Investment Activity
 Download Chapter Financial and Economic Performance
 Rating
 Loan Portfolio
 Management System
 Governing Structure Of JSC Russian Railways
 Personnel management
 Housing policy
Service functions
-
Download center
-
Add to My Report
-
My Report (0)
-
Print this Page
-
Download in PDF
-
Share
-
Feedback
-
Interactive analysis
-
Browsing history
-
Offline version
-
Company in soc.networks
-
Compared to 2011
-
Popular pages
-
Company on the map
-
Compact view
Send report to e-mail
| Enter e-mail recipient * | Your e-mail * | Comment : | |
| * required fields | |||
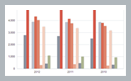
Dynamics of Freight Transportation Volumes of JSC “RZD”

JSC “RZD” Annual report 2012 www.rzd.ru Dynamics of freight transportation volumes of JSC “RZD” freight transportation volume trends, production indicators
| Indicators | Change in 2011 versus 2010 | ||||
|---|---|---|---|---|---|
| Units of measurement | 2011 | 2012 | +/− | % | |
| Loading | mln tons | 1,241.5 | 1,271.9 | 30.40 | +2.4% |
| average daily loading | th. tons | 3,401.5 | 3,475.0 | 73.5 | +2.2% |
| gross tkm, including: | gross mln tkm | 4,066,311 | 4,210,447 | 144,136 | +3.5% |
|
gross mln tkm | 3,469,882 | 3,594,259 | 124,377 | +3.6% |
|
gross mln tkm | 596,429 | 616,187 | 19,758 | +3.3% |
| Work performed | bln tkm | 2,844.6 | 2,927.2 | 82.62 | +2.9% |
| Freight turnover: | bln tkm | 2,704.8 | 2,782.6 | 77.85 | +2.9% |
|
bln tkm | 2,127.8 | 2,222.4 | 94.55 | +4.4% |
|
bln tkm | 576.9 | 560.2 | −16.71 | −2.9% |
| Static load | t/car | 60.42 | 60.77 | 0.36 | +0.6% |
| Service speed of a freight train | km/h | 37.1 | 36.0 | −1.10 | −3.0% |
| Operating speed | km/h | 46.5 | 45.2 | −1.30 | −2.8% |
| Freight car standby at a train station | hour | 8.31 | 9.18 | 0.87 | +10.5% |
| Daily average performance of a freight locomotive | th. t-km | 1,812 | 1,791 | −21.00 | −1.2% |
| Daily average distance of a locomotive | km | 593.6 | 585.4 | −8.20 | −1.4% |
| Average weight of a freight train | tons | 3,868 | 3,891 | 23.00 | +0.6% |
| Freight car turnover | day | 14.40 | 15.49 | −1.09 | −7.0% |