 Address of the President
 175th Anniversary of Russian Railways
 Analysis
 Save Key Indicators to XLS
 Transport Development Strategy
 Investment Activity
 Download Chapter Financial and Economic Performance
 Rating
 Loan Portfolio
 Management System
 Governing Structure Of JSC Russian Railways
 Personnel management
 Housing policy
Service functions
-
Download center
-
Add to My Report
-
My Report (0)
-
Print this Page
-
Download in PDF
-
Share
-
Feedback
-
Interactive analysis
-
Browsing history
-
Offline version
-
Company in soc.networks
-
Watch report 2011
-
Popular pages
-
Company on the map
-
Compact view
| Enter e-mail recipient * | Your e-mail * | Comment : | |
| * required fields | |||
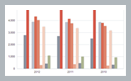
Export Freight Loading
In 2012, the daily average volume of export freight loading reached its peak: 1,123 th. tons a day. Export freight accounts for nearly a third (32%) of the total volume of loading; it is redirected to Russian ports.
This year, loading to ports accounted for nearly 20% of the network loading volume. This is also a historical peak that exceeded last year’s level by 7.2% and the level in 2007 by 31%, or 200 th. tons a day.
The export freight loading volume is growing dynamically: the increase versus last year is +2.8%, (and versus pre-crisis 2007 +5.3%). Export freight loading to Russian ports and bulk plants is growing faster: +8% (+17 mln tons) in 2012. Car unloading at ports increased by 9% versus 2011.
Loading to ports of the Far East remains historically high; it continues growing despite an expected stabilization. Current material flow requires 27 additional train pairs to run along the trans-Siberian line and Baikal-Amur mainline and unloading increased by 1,600 cars a day.
Meanwhile, transportation of Russian export freight to ports in the Ukraine has significantly declined (−43% versus 2007). There are opportunities to increase loading for this destination.
Loading to ports of CIS and Baltic states also decreased, accounting for only 5% of the total loading and 16% of export freight loading. However, considerable volumes of export freight transportation — 93 th. tons a day (+44% versus 2007) are directed to Latvian ports. This freight traffic that runs in transit through Byelorussia contributes considerably to the Moscow Railway load. However, there is virtually no possibility to send it via the Rudnya border crossing. Neither are there opportunities for this destination via Posin and Skangali junctions.
Loading outside Russian railways towards border crossings with CIS and other countries amounted to 488 th. tons a day (−2.4% versus 2011 and −16% versus 2007). These include Russian railways border crossings with other countries amounting to 105 th. tons a day (3% of the network loading). In the latter instance, there are opportunities to increase loads: this indicator is 19% lower than in 2007, but 4.3% higher than in 2011.
Overall, the share of transportation to Russian ports, the most challenging in operational terms, is growing at an important rate. Apart from train traffic organization, the ability to operate in this area depends on the development of logistics technologies, estimated capacity and equipment of unloading platforms, ship approaches, weather and other conditions. Targets regarding the implementation of potential transportation to Russian ports were determined in 2012 at meetings of the JSC “RZD” Scientific and Technical Council in Ust-Luga and Gelendzhik.
Export freight loading to ports and bulk plants, border crossings
| Indicators | Loading volume in 2012, th. t a day | Change versus 2011 | Change versus 2007 |
|---|---|---|---|
| Loading to Russian ports, total | 635 | +7% | +31% |
| Far East of Russia | 206 | + 6.0% | +100% |
| North-West of Russia | 273 | +12% | +21% |
| Azov and Black Sea ports of Russia | 150 | 4.6% | 6.7% |
| Ports of Ukraine | 49 | −19% | −43% |
| Ports of CIS and Baltic countries | 187 | −12% | −15% |
Main railway freight flow directions
Freight transportation volumes inside Russia grew more slowly than international transportation (+2.4% versus +4.4%, correspondingly).
Transportation volumes outside Russia grew 4.1% and their share of transportation accounted for 28.9%. Exports to ports increased 8.7% with decreases at border crossings (−1.3%). Volumes of transit cargo transportation grew strongly (+10.1%).